It was a volatile week for the Indian benchmark indices. Sensex, Nifty 50 and the Nifty Bank indices oscillated up and down within a range the whole of last week. The price action last week indicates both the bulls and bears are having a tough fight to take the market on their side. While a further fall from the current levels cannot be ruled out, supports are coming up to limit the downside. As such, we can expect the Indian benchmark indices to rise back again either from here itself or after a little more fall.
Among the sectors, the BSE IT index, down 2.81 per cent, was beaten down the most. The BSE Realty and BSE Health Care indices outperformed last week. They were up 2.54 per cent and 2.64 per cent respectively.
FPI action
The foreign portfolio investors (FPIs) continue to sell Indian equities. They sold about $584 million in the equity segment last week. In September, the FPIs have pulled out about $1.77 billion from Indian equities. This has snapped the six-month buying spree from the FPIs. If the FPI sell-off intensifies, then the Sensex and Nifty might find it difficult to rise back strongly.
Nifty 50 (19,638.30)
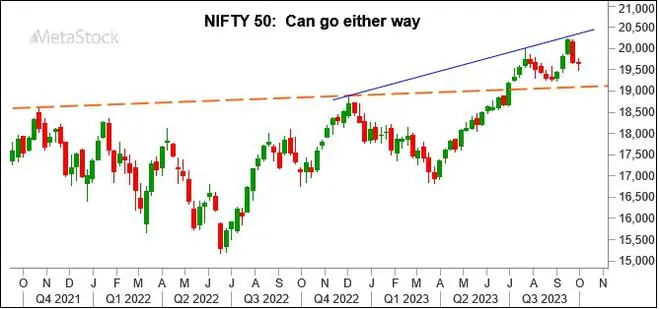
Nifty fell to test the support at 19,500 as expected last week. The index made a low of 19,492.10 and has risen back well from there recovering most of the loss towards the end of the week. Nifty has closed at 19,638.30, down 0.18 per cent.
Short-term view: The outlook is unclear. On the weekly chart, last week’s candle indicates indecisiveness in the market. Supports are at 19,500 and 19,400. Resistance is in the 19,800-19,850 region. So broadly, 19,400-19,850 can be the trading range for this week.
A strong break above 19,850 can bring back the bullishness. Such a break will open the door for Nifty to rise towards 20,100-20,200 again. On the other hand, a break below 19,400 can drag the index down to 19,200 and 19,100.
Our preference will be to see the Nifty breaking above 19,850 and rise towards 20,100-20,200 again.

Chart Source: MetaStock
Medium-term view: As seen from the monthly candles, Nifty has been oscillating in a range over the last three months. Support is at 19,100-19,000. Resistance is around 20,400. For now, 19,000-20,400 can be the broad trading range and it remains intact.
As long as the index stays above 19,000, the bias is bullish. As such, we can expect a breakout above 20,400 in the coming months. Such a break can take the Nifty up to 21,500 over the medium term.
The bullish outlook will get negated only if Nifty declines below 19,000. In that case, a fall to 18,200-18,000 can be seen. But such a fall is unlikely in the absence of any new strong negative trigger.
Nifty Bank (44,584.55)
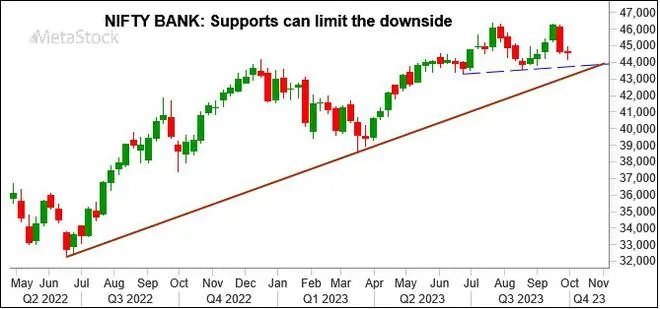
The break below the key support level of 44,450 did not sustain. The Nifty Bank index fell to a low of 44,182.50 and recovered most of the loss. The index has closed at 44,584.55, down marginally 0.06 per cent for the week.
Short-term view: The near-term outlook is unclear. Support is at 44,200. Resistance is at 45,000. A breakout on either side of these levels will determine the short-term move.
A break below 44,200 can take the Nifty Bank index down to 43,750 or 43,500. On the other hand, a strong break above 45,000 will bring back the bullishness. Such a break will take the Nifty Bank index up to 46,000-46,300 in the short term.

Chart Source: MetaStock
Medium-term view: The big picture is still bullish. Strong support is in the 43,500-43,000 region As long as the index stays above 43,000, the bullish view of the Nifty Bank index targeting 48,650-48,700 on the upside will remain intact. A strong break above 46,000 can trigger this rise.
The medium-term outlook will turn negative only if the index breaks below 43,000. In that case, though looks less likely at the moment, a fall to 42,000-41,500 can be seen.
Sensex (65,828.41)
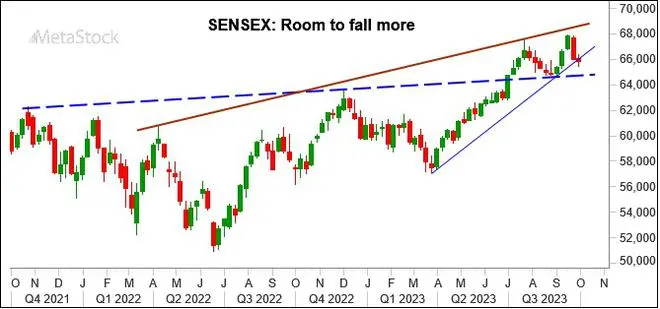
Sensex remained volatile between 65,400 and 66,400 last week. The index has closed the week on a mixed note at 65,828.41, down 0.27 per cent.
Short-term view: The immediate outlook is unclear; 65,400-66,400 can continue to be the trading range. A breakout of this range will determine the next move.
A break below 65,400 can take the Sensex down to 64,800-64,700. On the other hand, a break above 66,400 can take the index up to 67,500-67,800. We will have to wait and watch.

Chart Source: MetaStock
Medium-term view: Strong support is around 64,500. As long as the Sensex stays above this support, the outlook is bullish to break 68,000 and rise to 70,000 and higher in the coming months.
The outlook will turn negative only if the Sensex declines below 64,500. Such a break can take it down to 63,000-62,000.
Dow Jones (33,507.50)
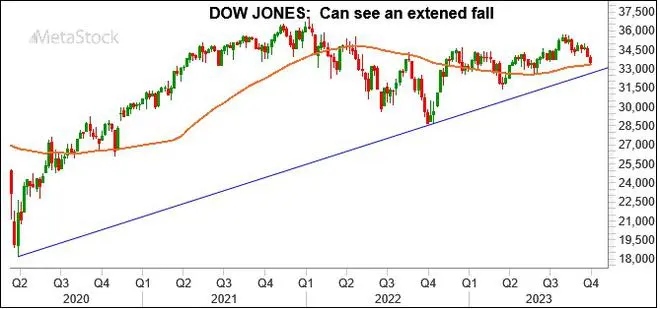
The Dow Jones Industrial Average extended the fall for the second consecutive week. The index fell to test its key support level of 33,300. It made a low of 33,306.30 on Wednesday and then had managed to sustain above it for the rest of the week. The Dow Jones had come-off sharply from its intraday high of 33,893.68 on Friday to close at 33,507.50, down 1.34 per cent for the week.

Chart Source: MetaStock
Outlook: Although the support at 33,300 is holding well, the price action on Friday indicates that the index is lacking fresh buyers to take it higher. This keeps the short-term picture weak for the index.
Immediate resistance is at 33,700. Above that, 34,000-34,300 is the next strong resistance. The Dow will have to rise past 34,300 to bring back the bullishness. But that looks less likely.
As such, we expect the Dow Jones to see fall further from here. It can test 32,800-32,600 in the coming weeks. Thereafter, a fresh rise is possible.
From a big picture perspective, this 32,800-32,600 is a very strong support zone. As such, dips to this support zone can be a good buying opportunity from a long-term perspective.


