Do you want to know whether Indian equities (Nifty 50) will outperform the US (Dow Jones Industrial Average), going forward? Are you wondering whether a sector will continue to outperform the market or if its fortunes will change? Ratio charts, a tool in technical analysis, can give you the answer.
All about ratio charts
Ratio charts are constructed by calculating the ratio between two variables on a continuous basis. For better understanding, let us take Nifty and Dow Jones as two variables, for instance. As mentioned above, if one wants to know whether Nifty can outperform the Dow, the first step is to calculate the ratio. Nifty divided by the Dow will give us the ratio. Then, take the historical closing values of both the indices for the time frame that one intends to analyse and calculate the ratio for the entire series of data. Plotting the same as a line graph will give the ratio chart. So, a ratio calculated by taking the daily closing value of Nifty and Dow will give us the daily ratio chart, weekly closing values will give us the weekly ratio chart, and so on.
When plotting the graph, two scenarios can arise – one, a rising trend and the other, a falling one.
The ratio graph can rise when
a) Nifty moves up – Dow Jones falls, or remains stable/range-bound or rises, but less than the Nifty
b) Nifty remains stable/range-bound – Dow Jones falls
c) Nifty falls – Dow Jones falls more than Nifty
The ratio graph can fall when
a) Nifty falls – Dow Jones rises, or remains stable/range-bound or falls but less than the Nifty
b) Nifty remains stable/range-bound – Dow Jones rises
c) Nifty moves up – Dow Jones rises more than Nifty
How to interpret
If the ratio chart is rising, then it means that the Nifty is outperforming the Dow Jones. Conversely, if the graph is falling, then Nifty is underperforming, and the Dow Jones is outperforming. Please note that here the numerator is the Nifty and denominator is Dow Jones. So, the rise and fall in graph will have to be interpreted with respect to the numerator, Nifty in our case here.
Do remember, also, that the ratio chart will give us only the relative performance of the two parameters being used — and not the direction of the absolute price movement. That is, a rising ratio chart does not mean that Nifty will rise. As explained above, even if the Nifty remains stable or in a range and the Dow Jones falls, the ratio chart can rise.
How to forecast
One of the major advantages of having a ratio chart is that technical analysis can be used to interpret the chart. All indicators used in technical analysis — such as the trendlines, moving averages, etc — can be applied. So, using these indicators, one can forecast where the ratio graph is headed. In addition to this, if you have the forecast for any one of the ratio variables, you can calculate/forecast the third variable.
Say, you have a forecast that the Nifty/Dow ratio can go up to a point X from current levels based on your technical analysis. If you have the forecast for the Dow Jones as Y, then X multiplied by Y will give you the forecast for the Nifty.
The caveat
An important factor to consider here is the time period. The forecast for the ratio and the one variable should be done for the same period. That is, if you are expecting the ratio to go up to the point X in, say, three months, then you will have to have the forecast for the Dow Jones also for the same time period of three months. Else, the logic of identifying the third variable will go wrong.
Secondly, the forecast on the Nifty can go wrong if the analysis or the projections made on the Dow Jones, or the ratio goes wrong.
Using the above-mentioned technique, we identify how the Nifty can perform against the Dow Jones and the sectors over a period of next six months . Here is the analysis.
India to outperform the US
The ratio chart signals that the Nifty is all set to outperform the Dow Jones Industrial Average, going forward. The Nifty/Dow ratio is currently at 0.5579. It has a strong support at 0.55, which can be tested in the near term. So, if the ratio dips to 0.55 and the Dow Jones remains in the range of 34,650-34,300, then the recent fall in the Nifty can find a bottom anywhere between 19,000 and 18,850.
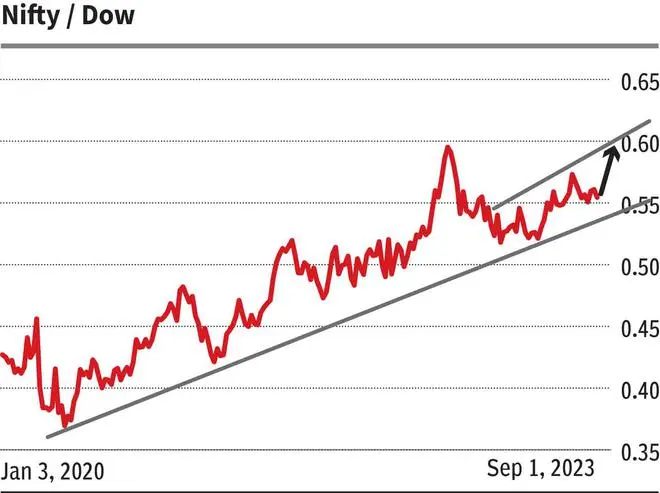
From 0.55, Nifty/Dow ratio can see a fresh rise targeting 0.59 and 0.60 over the next six months, that is, possibly in the first quarter of 2024. That would mean that the Nifty will outperform the Dow Jones in the coming months.
On the charts, the Dow Jones has strong support around 34,000. It has potential to target 38,000-39,000 over the next six months.
So, as the ratio moves up to 0.59-0.60 and the Dow Jones to 38,000-39,000, Nifty can be anywhere in the range of 22,420-23,400 over the next six months.
Nifty Vs Mid and Smallcap
The Midcap and Smallcap indices have outperformed the Nifty this year. The Nifty Midcap 100 and the Nifty Smallcap 100 indices are up over 25 per cent each so far this year while the Nifty 50 has risen just over 7 per cent. Will the smallcap and midcap indices continue to outperform? Yes, is the answer from the ratio charts.
Nifty/Midcap: The Nifty/Nifty Midcap 100 ratio is currently at 0.50. The trend has been down for more than two years, indicating that the midcap index has been outperforming the Nifty. The ratio can go down to 0.42-0.4 over the next two quarters.
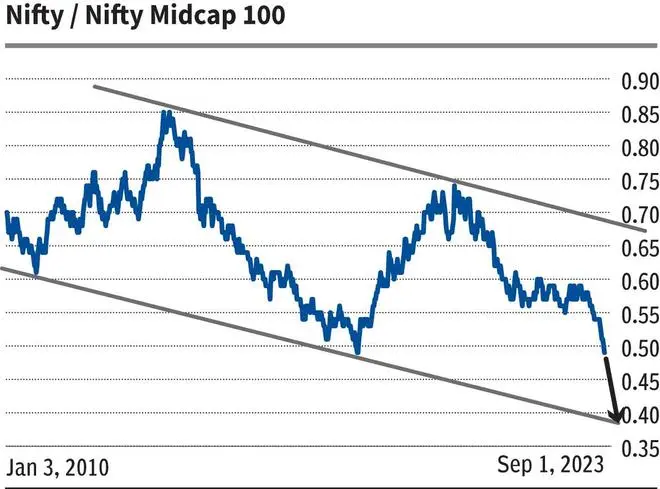
On the chart, the Nifty Midcap 100 index (39,445) has potential to target 50,000. For 0.42-0.4 on the ratio and 50,000 on the index, the resultant Nifty values would be 21,000 and 20,000.
Nifty/Smallcap: The Nifty/Nifty Smallcap 100 ratio has been coming down sharply since April this year. The ratio has broken below a key support around 1.70. The outlook is bearish. Any intermediate bounce can be capped at 1.70. The ratio can fall to 1.4-1.3 from current levels.
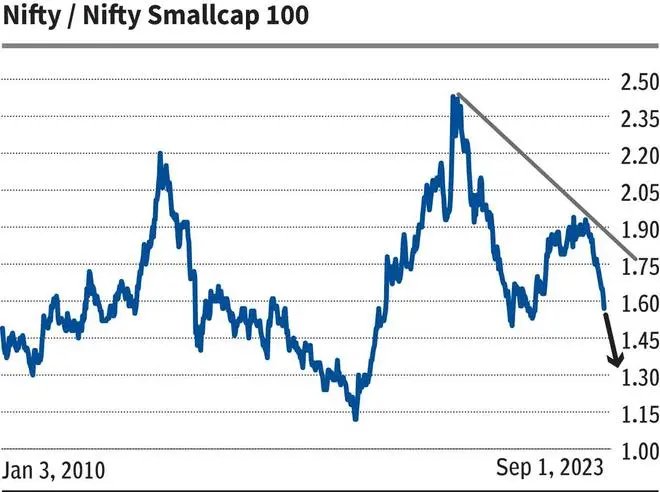
The Nifty Smallcap 100 (12,386) is looking bullish to target 17,000 from here. So, Nifty will be in the range of 22,100 and 23,800 as the ratio moves to 1.3-1.4 and the smallcap index rallies to 17,000.
Sectoral outlook
Pharma, IT and PSU Banks are three sectors that are likely to outperform the benchmark index Nifty 50, going forward. Here is what the charts say.
Nifty/Nifty PSU Bank: The long-term trend for the Nifty/Nifty PSU Bank ratio has been down since November 2020. The ratio is currently at 4.25. Outlook continues to remain bearish. The ratio can fall to 3.8-3.7.
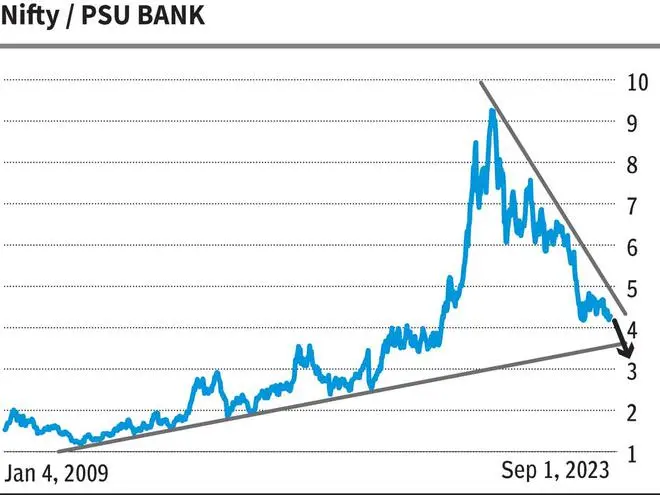
The Nifty PSU Bank index (4,538) has risen well above its crucial resistance level of 4,000 this year. Outlook is bullish for the index to target 5,800. So, the Nifty will be in the range of 21,460–22,040 if the ratio goes down to 3.8-3.7 and the index moves up to 5,800.
Nifty/Nifty Pharma: The ratio has been falling since late May this year, indicating that the Pharma sector is outperforming the Nifty 50 index. The Nifty/Nifty Pharma ratio is currently at 1.28. It can fall to 1.15.
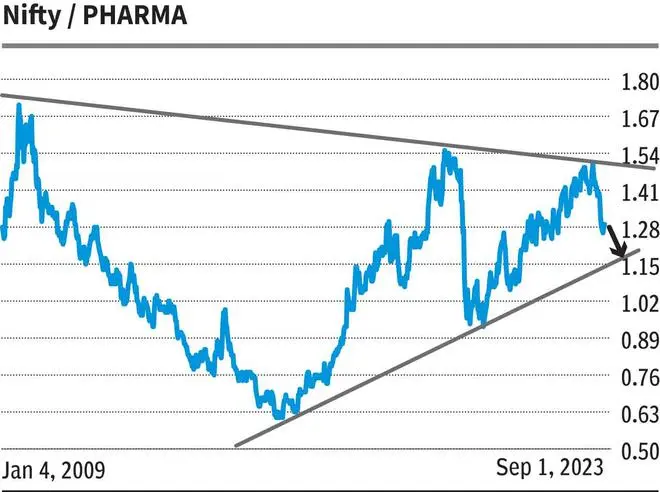
Nifty Pharma index (15,011) is looking bullish. The index can target 18,000-18,300 on the upside. So, as the ratio falls to 1.15 and the index moves up to 18,000-18,300, Nifty 50 will then be in the range of 20,700-21,045.
Nifty/IT: The ratio, currently at 0.63, is hovering just below a key trend resistance at 0.67. This could just be the beginning of a fresh leg of downmove in the ratio. A fall to 0.55-0.53 can be seen from here initially.
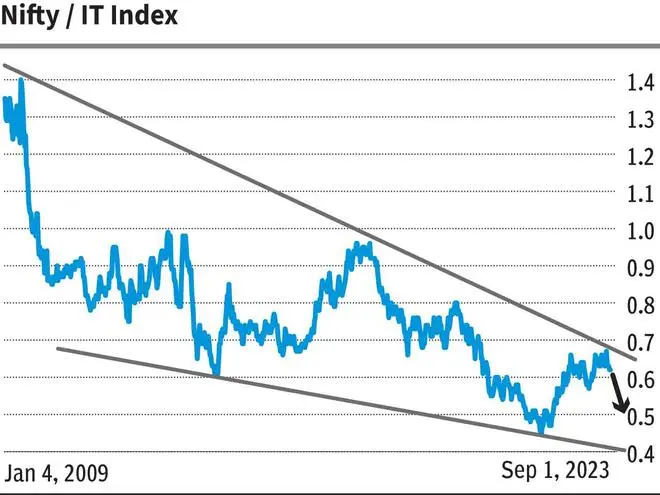
The Nifty IT index (31,514) has an important resistance around 32,300. A strong break above it can take the index up to 38,000. As a result, Nifty can be in the range of 20,140-20,900.
From a long-term perspective, the Nifty/Nifty IT ratio has potential to fall even up to 0.4. This indicates that the IT sector, which has been underperforming for more than a year now, will become strong over the next year or two.
Takeaway
From all of the ratio analysis illustrated above, it is clear that the Nifty 50 is likely to rise towards 20,000 and higher levels in the coming months. As such it is evident that the recent fall in the Nifty is just a correction within the overall uptrend. A fresh leg of upmove is likely to begin soon. So, this is a ‘buy on dips’ market.
However, if the assumptions, variables forecast goes wrong, then the view on Nifty will also change accordingly.


