

The popularity of futures and options (F&O) trading is growing by leaps and bounds in India. According to a report by the Futures Industry Association (FIA), the number of futures and options contracts traded (volume) on the National Stock Exchange (NSE), the leading derivatives exchange in India, in June 2023, stood at 6 billion — 60 per cent of the global volume.
In the January–June period of this year, the volume stood at nearly 33 billion contracts, again 60 per cent of the global volume. In the first half of 2023, the number of contracts traded on NSE increased by 103 per cent, outpacing the global average growth of 44 per cent.
However, derivatives are a risky product. If not clearly understood and managed well, theycan lead to enormous losses. Financial damage apart, this can be emotionally daunting too.
In an effort to clarify the risks involved and simplify things, at bl.portfolio we have been running a derivatives series. Through this, we have been explaining the brass tacks of options trading and have also been covering various option strategies suited for different market/stock scenarios/outcomes. We explained how and when to implement each strategy depending on the outlook of the underlying security.
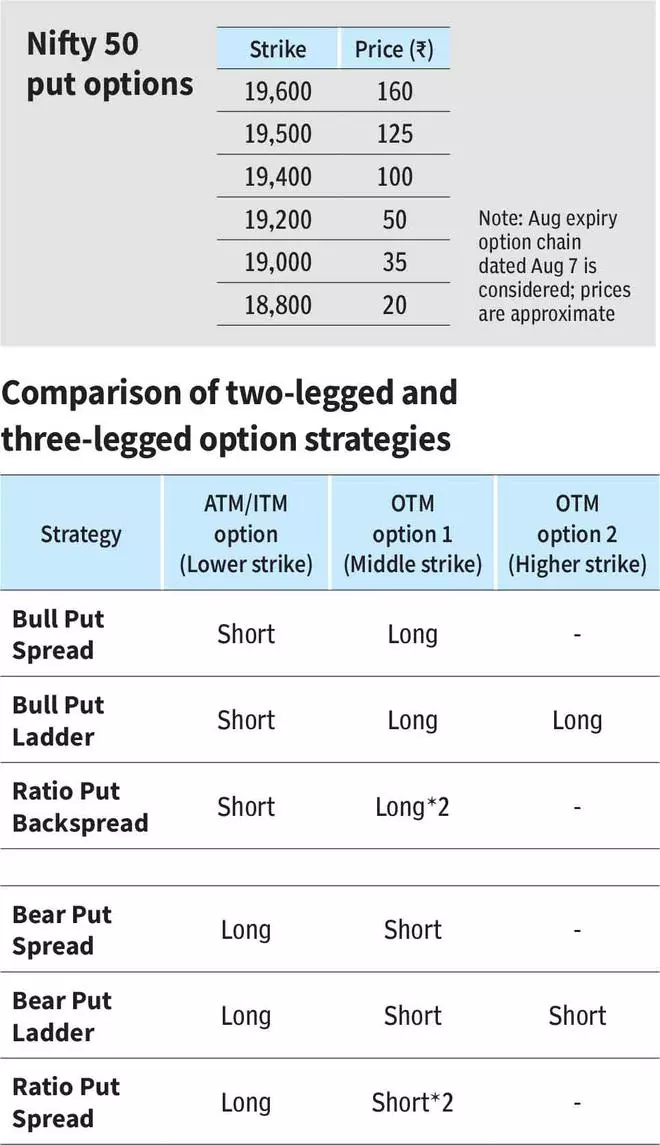
In the Big Story published on Feb 26 and May 7, 2023 , we covered a few single and multi-legged ideas. As an extension, in this Big Story, we will discuss four more three-legged strategies that are based on put spread i.e., bull/bear put spread. The strategies involve taking trades in all three ATM (at-the-money), OTM (out-of-the-money) and ITM (in-the-money) options.
Also Read: Know about an ATM/OTM/ITM option
Before going further, we will briefly discuss the base strategies – bull put spread and bear put spread. Bull put spread is implemented by selling (also referred to as shorting) ATM put and simultaneously buying equal number of OTM put of the same underlying and expiry. Bear put spread is executed by buying ATM put and parallelly shorting the same number of OTM put. In both cases, instead of ATM options, it can also be slightly ITM or OTM options. The idea is to spread the strikes of the buy and sell leg of the trade.
The first two strategies discussed below are based on bull put spread whereas the following two will be based on bear put spread.
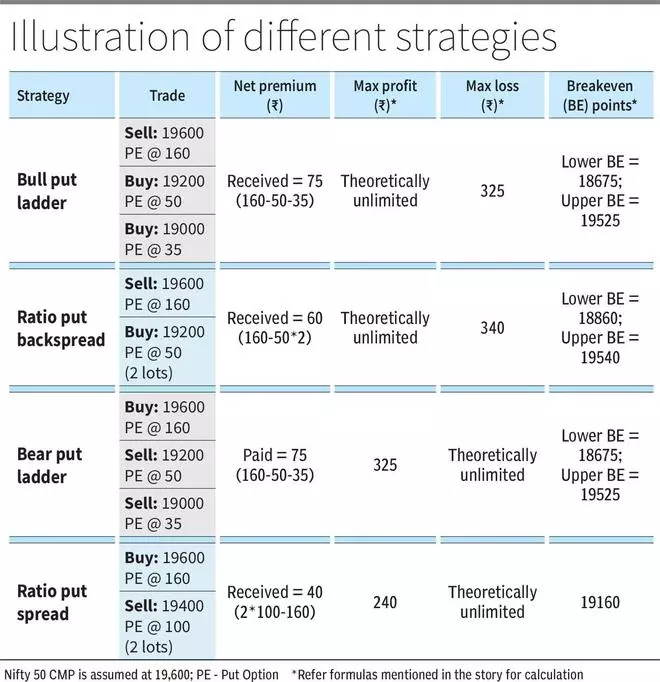
BULL PUT LADDER
As an extension of bull put spread, in this strategy, an ATM put (higher strike) is sold and simultaneously an OTM put (middle strike) is bought. In addition to this, another OTM put (lower strike), with strike price lower than the middle strike OTM put is bought. The underlying and the expiry date are the same for all three options.
It is termed ‘ladder’ because the strategy is constructed by initiating trades in three different strike prices. This can be related to the ladder i.e., the structure that we use to climb.
Generally, bull put spread is set up as a net credit strategy when you will be the receiver of premium on net basis after initiating all three legs. It can also be set up for net debit depending on the strike price of the three legs.
The strategy at initiation is bullish but beyond a point, it becomes bearish. The trade will be rewarding if the underlying security stays above the higher strike, if not a rally. Also, you will be profitable if the price of the security plummets. The key aspects of this strategy are below.
When to implement
An asset is trading above a crucial support and if this is breached, it is likely to see a sharp fall in price. After executing, if the security remains above the support (higher strike i.e., the short leg is usually matched to this support level) until expiry, you gain the net premium.
Alternatively, if it slips below the support and declines sharply, you can make money. More the profit depending on how deep the asset price falls below the lower breakeven price. Hence, choosing the strikes is important.
If the middle and lower strike are far below the higher strike, the price should fall more for your trade to turn profitable. Yet, in this case, the net premium you receive at initiation of this strategy will be higher as farther middle and lower strike means lesser outgo in the form of premium.
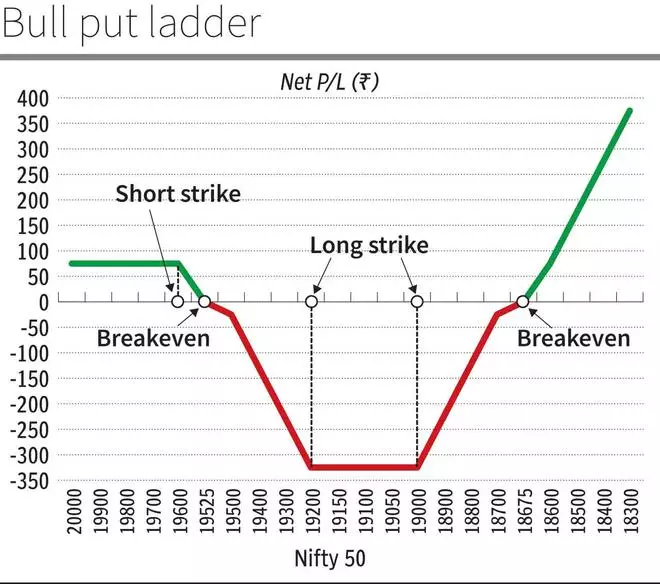
Maximum profit
Theoretically unlimited below the lower breakeven price. But if the security stays above the higher strike price, the maximum reward is limited to the net premium received.
Maximum loss
Higher strike – Middle strike – Net premium received
Breakeven points
Upper breakeven = Higher strike – Net premium received
Lower breakeven = Lower strike + Middle strike – Higher strike + Net premium received
RATIO PUT BACKSPREAD
Similar to bull put ladder, there are three legs in this strategy i.e., one short put and two long puts. Here’s the difference — while the short position is created on an ATM option, the two long OTM puts are of the same strike rather than two different strikes as in bull put ladder.
Other similarities of ratio put backspread with bull put ladder are that it is bullish at the time of initiation but becomes bearish at some point and this strategy is generally set up for net credit. The net credit and risk will be higher if the distance between long and short strikes is larger and vice versa.
This trade can be profitable on two occasions. One, the underlying asset stays above the higher strike i.e., ATM put on expiry and two, the price of the underlying falls rapidly.
It is called ratio because there are two long puts (same strike) for one short put. Therefore, in this case, it can be referred to as 2:1 ratio put backspread. You can also construct a 3:2 ratio put backspread where there are three long puts of the same strike for two short puts.
When to implement
The underlying security, trading above a support, is expected to stay above this level but there is also a chance that a breach of this support can result in sharp depreciation in price.
Hence, theoretically, the potential for profit is unlimited. In other words, more the underlying declines below the lower breakeven, more the profit. That way, this strategy, like a bull put ladder, can be appealing as the loss is limited but the maximum reward can be enormous.
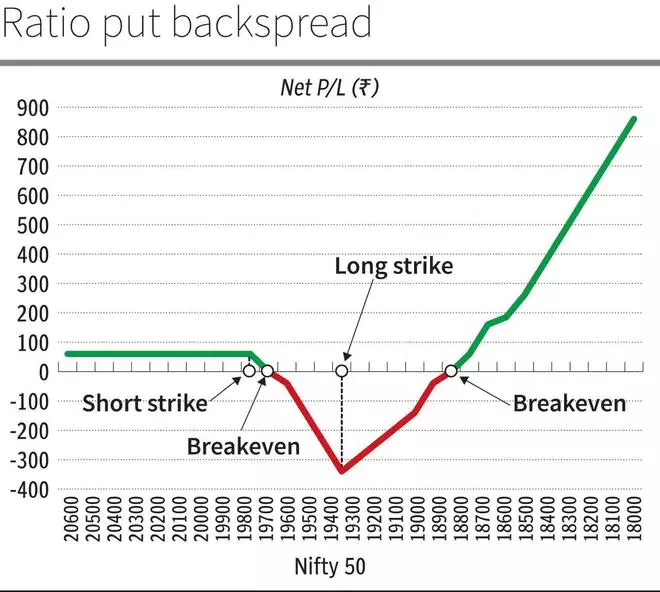
Maximum profit
Theoretically unlimited below the lower breakeven price. But if the security stays above the higher strike price, the maximum reward is limited to the net premium received.
Maximum loss
Higher strike – Lower strike – Net premium received
Breakeven points
Upper breakeven = Higher strike – Net premium received
Lower breakeven = Lower strike – difference between higher and lower strike + Net premium received
BEAR PUT LADDER
Like a bear put spread, an ATM put (higher strike) is bought and at the same time, an OTM put (middle strike) of the same underlying and expiry, is sold. In addition to these two legs, one more OTM put (lower strike), with strike price lower than the middle strike is short simultaneously to turn the strategy into a bear put ladder. As mentioned earlier, this is called a ladder because of the three different strike prices.
Usually, it will be a net debit strategy. Bear put ladder works best when the underlying security sees a moderate decline in price. While net credit is possible, it makes sense to opt this in ratio back spread, which we will discuss next.
The additional OTM put is short so that the cost of the long side (ATM put) is brought down to the extent of the premium received by selling the lower strike put. This will also move the upper breakeven a little higher i.e., nearer to the ATM long put. Consequently, the trade can enter the profit zone quicker than in bear put spread.
However, note that the losses can be huge if the price of the security tumbles. Because, out of the three legs, one long put, and one short put will cancel out each other but the additional put sold will be exposed to the risk of a sharp fall in price. Hence, theoretically, the losses can be unlimited.
When to implement
Go for bear put ladder in the following scenario. The underlying security is now facing a resistance. On the back of this barrier, the price is likely to see a decline. However, the fall might be limited because the overall trend remains bullish and there is a strong support that can prevent a deeper fall until the expiration of the prevailing series. Remember to match this support level to the strike price of the lowest leg.
The strategy will give the most profit when the security price lies between the middle and lower strike on expiry. So, the profit potential is limited. On the other hand, the downside risk is unlimited. So, consider exiting the trade if the underlying price falls below the lower breakeven and you think that the downside could continue because the support is breached. Strictly adhering to stop loss limits is very important in such strategies.

Maximum profit
Higher strike – Middle strike – Net premium paid
Maximum loss
Theoretically unlimited below the lower breakeven price.
Breakeven points
Upper breakeven = Higher strike – Net premium paid
Lower breakeven = Lower strike + Middle strike – Higher strike + Net premium paid
RATIO PUT SPREAD
Like bear put ladder, it all starts with bear put spread. So, an ATM put (higher strike) is bought and an OTM put (lower strike) is sold. For ratio put spread, instead of selling one lot of OTM put, two lots are short. Like we explained earlier, this strategy can be a 1:2 or 2:3 ratio put spread.
Ratio put spread is different from bear put ladder from the fact that the two lots of an OTM put with the same strike is short in the former whereas in the latter, one lot each of OTM put with different strikes is sold.
That said, ratio put spread is a neutral to mild bearish strategy and traders can get the most out of it if the underlying sees a minor decline. So, the short leg of this strategy is usually matched with the nearest strong support so that the downside is possibly limited.
But note that because of the one additional short put, the strategy exposes traders to the risk of a significant fall in price and thus, the risk is theoretically unlimited. Hence the use of stop-loss is imperative.
Typically positioned as a net credit strategy, it can be implemented for net debit as well.
When to implement
Facing a resistance, the underlying asset is set to undergo a price correction. But this downward movement is likely to be temporary and stopped by a support. It is best suited when the probability is high for the stock to decline towards the support and stay around that level until the expiration of the contract. The strike price of the put that you short should be closer to the support level.
That said, be wary of the potential for huge loss if the underlying witnesses a deeper fall. The magnitude of loss is directly proportional to the extent of fall. Therefore, having an exit plan i.e., placing a stop-loss, is crucial in this trade.
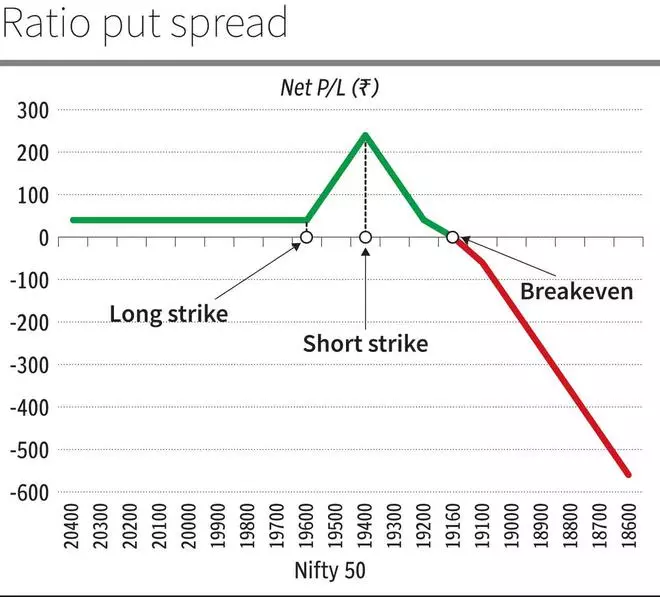
Maximum profit
Higher strike – Lower strike + Net premium received
The above is when the underlying declines. But in case the price rallies, the maximum reward will be limited to the net premium received
Maximum loss
Theoretically unlimited below the lower breakeven price
Breakeven point
Lower strike – Difference between both strikes – Net premium received
![]() Comments
Comments
